Adam Jones: Too Good to be True?

Posted in Offense with tags , , on May 7, 2013 by oriolesprovingground

Many Orioles have gotten off to a great start in 2013.  Last week we took a look at the hot start of Chris Davis, to determine if his success was due to good luck, or a change in approach.  This week, we’ll take a gander (thank you Microsoft Word thesaurus!)* at the hot start for Adam Jones, and see if we can answer the same question.

*just kidding, I don’t need Microsoft Word’s thesaurus to help me write anymore

As of May 6, Adam Jones is the owner of a very healthy triple slash line, which is sitting at .331/.360/.519 (AVG/OBP/SLG).  All of three are above the levels of his breakout 2012 season, when those statistics were also career highs.  Despite the .519 slugging percentage, he is hitting for slightly less power this year compared to less, as his ISO is currently 0.030 lower than it was in 2012.  Still, between last year and 2013’s great start, the Orioles front office and its fans are feeling pretty good about that extension Jones signed last year to stay with the team through 2018.

Similar to Davis, the first thing that jumps out about Adam Jones’ season so far is his extremely high BABIP, which is currently at .400 (career .320 BABIP), and ranked as the 7th highest in all of baseball (Chris Davis is ranked 17th).  While BABIP can be an indicator of good or bad luck, luck is not the only reason for a high or low BABIP.  As previously discussed in the Davis post, hitters who are fast and hit line drives have a better chance to maintain high BABIP’s.  Jones certainly has above average speed and his line drive rate is currently 3.3% above his career average.  However his 2013 LD% is basically the same as it was last year, when his BABIP was .313.

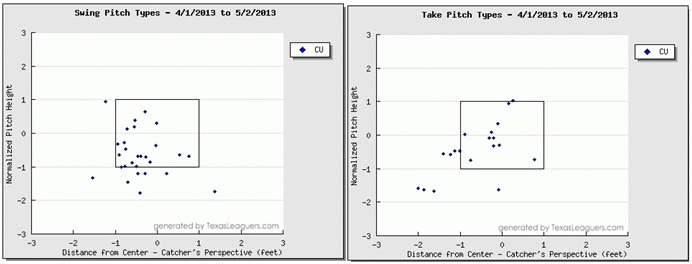
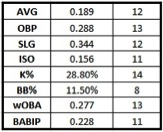
One reason being touted for Jones’ great start to the season has been his improvement when hitting with two strikes.  The numbers back this up, as Jones is hitting .302/.333/.476 with two strikes in 66 PA’s.  He also has an ABSURD .545 BABIP with two strikes.  Read that last sentence again.  In a count where the pitcher likely has a huge advantage, Jones getting hits on over half of the balls he puts in play.  In his career, Jones’ numbers with two strikes look a lot different, with a line of .211/.257/.329 and a BABIP of .331.  Even Chris Davis has a.228/.297/.491 line, with a BABIP of .409, is not even close to Jones’ two strike numbers in 2013.

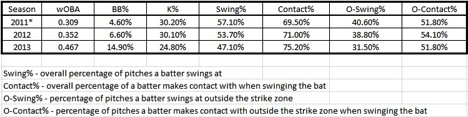
While there is no reason why Jones will keep up his pace with two strikes, maybe he has changed his approach at the plate with two strikes through a shortened swing, better strikezone awareness, etc.  I have admittedly not watched enough Orioles games this year to make that claim one way or another, but the plate discipline numbers do not back this up.  Cue the table!

table

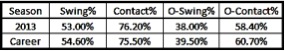
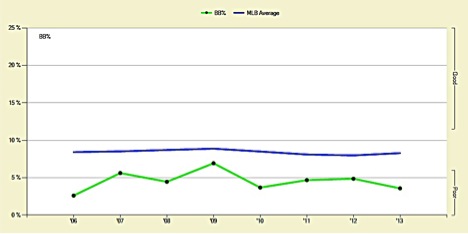
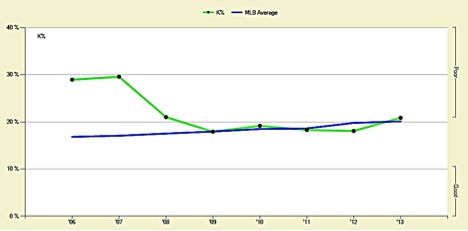
Jones is basically right around his career averages in the above plate discipline categories.  These numbers in addition to his current walk and strikeout rates don’t really show any sort of change in approach.  Jones has never been known to take a lot of walks, but so far in 2013, both rates are trending in the wrong direction (the blue line indicates league average).

BB Rate

BB Rate

K Rate

K Rate

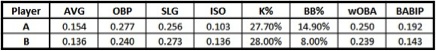
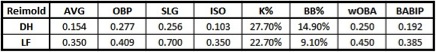
Finally, before we finish up, let’s look at a couple players in the BABIP top ten with similar BB%, K%, and AVG/OBP/SLG as Jones…

compare

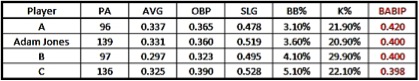
Any idea who those players might be?  Hint: it’s probably not who you were hoping for.

  • Player A is Chris Johnson, third baseman for the Atlanta Braves.  If his name sounds familiar, he was part of the package Arizona sent to the Braves with Justin Upton this past offseason.  Over the course of his career (1,400+ PA’s), he’s basically been your average hitter, with a career triple slash line (AVG/OBP/SLG) of .279/.318/.432.
  • Player B is Nick Hundley, catcher for the San Diego Padres.  Hundley has almost 1,500 major league PA’s in his career and has been a below average hitter, with a .242/.300/.397 line.
  • Player C is Starling Marte, left fielder for the Pittsburgh Pirates.  Marte has accumulated roughly a half season of PA’s in his two years in the majors and was one of the Pirates top prospects as recently as last year.  Scouts love his potential, but a lot believe he will never learn the plate discipline needed to reach it.  I don’t believe that it is unrealistic to say that Marte would be fortunate if his ceiling is Adam Jones type production, but he has a long road to get there.

If you don’t feel good about these players continuing to produce at those levels for the rest of the year, you shouldn’t, because it’s not likely that they will.  Unfortunately, the same can be said of Jones, especially since his plate discipline numbers indicate that his approach at the plate has not been any different this year than in previous years.  At some point, Jones’ balls in play will stop finding holes (especially with two strikes), and his numbers will regress to last year’s levels, or even closer to his career levels.

Chris Davis: Too Good to be True?

Posted in Offense with tags , , , on May 4, 2013 by oriolesprovingground

On Tuesday, Matt Kremnitzer over at Camden Depot took a look at the hot start to the season for Chris Davis, and came to the conclusion that his early season success can be attributed to his improved plate discipline.  Kremnitzer has a similar table in his piece, but take another look to see just how much Davis’ approach at the plate has improved so far this year, compared to his previous time with the Orioles (updated numbers for 2013).

Untitled

*2011 stats reflect Davis’ time with the Orioles only

Currently, Davis is sporting a triple slash line of .337/.438/.704, with a .467 wOBA (as of May 3rd).  Is he going to keep that up during the entire season?  Absolutely not!  But, as Kremnitzer pointed out in his piece, his improved approach at the plate is a very positive indicator that Davis has a good chance to continue his success over a sustained period of time.

However, before we start talking about Davis as a potential MVP candidate, there are some reasons to be skeptical of his hot start.  I bring this up not to be a “Debbie Downer”, but more to temper expectations.

The first (and easiest) indicator is with Davis’ BABIP, which is a lofty .387, despite a line drive rate that is currently a career low and roughly 3.5% below his career rate.  To put this into perspective, typically batters who hit a lot of line drives and/or are fast can sustain a high BABIP.  For example, Ichiro Suzuki has a career .347 BABIP, and Dexter Fowler (who is speedy) led the league in BABIP last year with .390.  He also happened to lead the league in LD% at 27.2%.  Davis is nowhere near as fast as Fowler and currently has a LD% of 19.7%.  However, the career BABIP of Chris Davis sits at .338, so even a regression to his career level won’t send his overall numbers off a cliff.  This is the good news.  Now here comes the bad news.

Chris Davis swings at fastballs down and in…and crushes them.  Check out the figure showing his SLG on fastballs over his career by zone, courtesy of Brooks Baseball and Baseball Prospectus (from catcher’s point of view).

SLG

You may say that’s not bad news, or even that it’s not news at all, but it sets up the bad news.  And that is that Chris Davis also swings at pitches that initially look like meaty fastballs down and in, but turn out to be breaking balls (curveballs and sliders) that dart out of the strikezone.  As a result, he DOES NOT crush them, and often times he misses them completely.  This time, our trusty figure shows his swing rate on breaking balls, again from the catcher’s point of view.

SWG

Pay special attention to the highlighted area out of the strikezone in the bottom right corner (pitches down and in to Davis) and make a mental note of how many times he swings at breaking balls there.  Now combine that swing percentage with the fact that he whiffs on breaking balls in that area more than 53% of the time (and 71.4% specifically in the zone on the bottom right).  Breaking balls thrown out of the strikezone down and in to Chris Davis is an undeniable weakness.

Let’s look at a few more figures, this time from 2013, courtesy of Texas Leaguers.  The first figure in each set shows pitch locations where Davis swung, while the second figure in each set shows pitch locations taken (again from the catcher’s point of view).  First, the sliders…

Sliders

Now, the curveballs…

Curveballs

For some reason, opposing pitchers haven’t thrown Davis many breaking balls down and in out of the strikezone this year.  I’m not sure why they wouldn’t throw breaking balls in that area with more frequency, other than the fear of making a mistake and getting punished (Davis will crush breaking balls that don’t find their way far enough inside).  Another potential reason could have something to do with the batters in front of Davis consistently getting on base, requiring pitchers to guard against the steal or a passed ball.  A pitch down and in to a left hander is a difficult spot for a catcher to receive, especially when trying to throw out a potential base stealer.

Chris Davis is off to an amazing start to the year and there are good reasons to believe that an improved approach at the plate is a bigger reason for it than plain old luck.  As the season progresses and pitchers throw more breaking balls out of the zone down and in to Davis, we’ll see if that improved approach includes laying off those pitches, giving us a better idea as to whether Davis is going to have another breakout year.

Orioles Currently Lacking a Designated Hitter Who Can Actually Hit

Posted in Offense with tags , , , , , on April 26, 2013 by oriolesprovingground

If you’ve been reading this site (or most articles involving the young 2013 baseball season), you’ve heard the words “small sample size” applied frequently.  And since teams have barely played more than 20 games so far, those same three words apply directly to everything I am going to be presenting in this post.  So if you want the answer to the “what should the Orioles do about their DH?” question without actually reading the rest of write-up, the answer will be along the lines of, “they should go with what they have, until there is a large enough sample of plate appearances to support a decision”.

Hopefully the title alluded to this, but the Orioles designated hitters have been bad so far this year.  They have collectively compiled -0.2 WAR (according to Fangraphs), which is currently ranked 15th out of 17 teams (not every National League team has played an interleague game in an American League park yet).  If you take out the National League teams, the Orioles move up to 13th(!)…out of 15.  Let’s take a look at some other offensive (double entendre!) statistics for the Orioles DH’s (as of April 26), but let’s limit the list of teams to AL clubs only, since all of the teams will have similar sample sizes.

(as of April 26, 2013)

as of April 26, 2013

Yikes.  Remember, each of these rankings is out of 15 teams.  Again, yikes.  You can point to the very low BABIP and make an argument that maybe they’ve been unlucky, but looking at the other statistics, it would appear to be a reach.

Nolan Reimold and Steve Pearce have held down the fort at the DH spot so far.  47 of Reimold’s 70 PA’s have come at DH (the others in LF and 1 as a pinch hitter), while Pearce has been used solely in the DH spot for a total of 25 PA’s.  Again, small sample.  Let’s put up their individual stats as a DH to compare the 2 players.  I’m not even going to tell which player is on which line, because as you can tell, it’s pretty pointless.

as of April 26

as of April 26

Since both players are pretty terrible hitting in the DH spot, is it possible that they’ve both been unlucky?  Reimold may be suffering from a bit of bad luck while it looks like Pearce is just suffering from being Steve Pearce.  Pearce is a 30 year old journeyman who has had some success against LHP, but not enough for a team to feel comfortable giving him regular at bats against them (career .258/.339/.456 against LHP in 289 plate appearances).  And he shouldn’t even face a right hander…pretty much ever.  Overall, he’s a career .231/.306/.365 hitter in almost 750 PA’s.  So if he is given more playing time, his numbers will probably improve, but not to the point where anyone should want him as a guy whose only job is to hit a baseball.

As for Reimold, he’s actually hit quite well in his 22 PA’s as a left fielder.  Comparing his numbers playing LF to his numbers in 47 PA’s as the DH…

as of April 26

as of April 26

…we see quite a difference.  If anything, Reimold may be on opposite ends of the luck spectrum during his time at the 2 different positions.  This provides some hope, as there is not much else they can do to improve at the DH position, other than hope that one of these 2 players becomes more productive in the DH spot.  It is WAY too early to talk about trading for anyone, and outside of (MAYBE) Russ Canzler, the Orioles don’t have anyone on their 40 man roster that would provide a substantial improvement.  One interesting option is to bring back Jim Thome, who has not declared retirement and remains unsigned.  While it wouldn’t take a lot of money to sign him, his presence wouldn’t automatically be an improvement, and his presence on the roster would severely limit the team’s roster flexibility, especially when they play games in NL ballparks (Thome cannot play anywhere in the field).

So if you’ve managed to keep reading after the answer was given in the first paragraph, the answer has not changed.  The Orioles should stay the course, continuing to use Reimold at the DH spot (in favor of Steve Pearce), and monitor the results.  If the DH numbers don’t improve by June, then it will be time to look seriously at other options.

Guest Post at Camden Depot

Posted in Pitching with tags , , on April 25, 2013 by oriolesprovingground

Today’s post is actually located at Camden Depot, the Baltimore Orioles blog for ESPN’s Sweetspot Network, as they were kind enough to allow me to be a guest writer for their site.  The post takes a look at Jake Arrieta’s recent demotion to AAA, and why he may not be entirely his fault.  Please go over there and check out my post, as well as the other posts at Camden Depot, as they have some terrific stuff about the Orioles.

Direct Link to Article –> Jake Arrieta Optioned to AAA:  Not (Entirely) His Fault

A Minor League Trade Usually Brings…Minor Changes

Posted in Trades with tags , , on April 11, 2013 by oriolesprovingground

This little nugget caught my eye about a week ago as I was browsing through the Baseball Prospectus website.  Apparently the Phillies and Orioles completed a trade, with the Orioles sending 25 year old OF Ronny Welty to the Phillies in exchange for 22 year old RHP Julio Rodriguez.  It’s a trade of two minor leaguers, each of whom have never played above AA in the minor leagues, but I wanted to briefly discuss the trade for two reasons:

  1. Julio Rodriguez was a Top 10 prospect in the Phillies organization as recently as 2011 (#8 according to ESPN’s Keith Law and #9 according to Baseball Prospectus)
  2. I was able to see Ronnie Welty play a decent amount while working for the Orioles AA minor league affiliate in Bowie last year

What the Orioles Received

As I said, Julio Rodriguez was rated as a top 10 prospect in the Phillies organization last year, although the Phillies minor league system has not been strong recently.  I have never seen him pitch, but his results prior to 2012 were promising, as seen in the table below.

Rodriguez1

The thing that sticks out the most is his impressive strikeout totals, which were over a batter per inning in every year and every level he pitched, with the exception of the 10 innings he threw in 2008.  There was a problem of course, and it was that the results weren’t matching what the scouts were seeing.  According to reports, Rodriguez relies heavily on a deceptive delivery, as his stuff, which includes a max velocity fastball in the high 80’s left a lot to be desired.  Scouts were/are skeptical about his lack of an above average pitch, were interested to see how he would handle AA lineups.  As you can see from his 2012 line in AA, it wasn’t encouraging.

Rodriguez2

Despite a high strikeout total, Rodriguez’s already borderline average command tanked, as he issued more than 5 BB’s per 9 innings, leading to a 4.70 FIP, and obviously falling out of favor with the Phillies front office.  Reports have mentioned that his pitches have looked worse and his arm has looked slow.  There are some who think he may have been injured, but injury or not, his 2012 performance was enough to remove him from prospect lists.

What the Orioles Gave Up

Unlike Rodriguez, Welty was never considered a top prospect in the Orioles minor league system.  He’s primarily a right fielder who handles the position adequately.  I wasn’t able to see a full minor league season from Welty, as he was injured for most of the season, only appearing in 37 games.  When he was in the lineup, I was most impressed with his power, as he slugged .564 and hit 8 HR’s in only 146 plate appearances.  His swing can get long, causing him to strike out a lot, so he may not hit enough to get to his power as he continues up the organizational ladder.  He will kill a fastball, but showed some trouble with better off-speed pitches.  Additionally, despite showing decent plate discipline in previous years, his walk rate dropped to 2.1% in 2012 (small sample size).  See his career minor league stat line below.

Welty

In my limited time seeing Welty play, I thought his ceiling could be that of a 4th or 5th OF in the major leagues, rather than an everyday player.

Conclusion

The Orioles pick up a former prospect that still has some upside, but will need to overcome quite a few hurdles to get back on the prospect map.  A move to the bullpen seems unlikely, as the below average fastball/poor command combo would be a disaster.  In return, they gave up an organizational outfielder who may see some time in the show, but likely won’t make much of an impact while there.  Essentially, there is a good chance that neither of these players reach the major leagues and that the average baseball fan will never know this trade even happened.

Over-Use of the Defensive Over-Shift

Posted in Defense, Strategy with tags , , on April 7, 2013 by oriolesprovingground

If you watched the Orioles play the Rays last Wednesday, you were treated to a great baseball game that included multiple lead changes, a blown save from Fernando Rodney (arguably the best relief pitcher in all of baseball in 2012), and a walk-off home run.  Unfortunately, that walk-off home run came off the bat of Matt Joyce, handing the Orioles their first loss of the season.  Fortunately, for my wife, it meant that the game would not be going to extra innings and she could change the channel.

The defensive shifts used by the Orioles in the 7th inning were a big part of Tampa Bay’s comeback.  Was it the result of bad luck or was it bad strategy?  It’s incredibly easy to second guess after the game is over, but let us take a closer look at the bottom of the 7th inning.

Pedro Strop entered the game with the Orioles leading 5-4.  No arguments with bringing Strop into the game here.  He doesn’t have the best command, leading to more walks than you’d like (especially in a 1-run game), but he had a good season in 2012 and was lights out in the World Baseball Classic for the Dominican Republic.  He was scheduled to face Ryan Roberts, Jose Lobaton, and Kelly Johnson…not exactly a murderer’s row.  Sam Fuld (career .347 SLG), pinch hitting for Roberts, hit a rocket right at Adam Jones for the first out.  Now here’s where I’m going to get fancy on you…

WE

Above is the Win Expectancy table for the game in question.  Fangraphs defines Win Expectancy as…“the percent chance a particular team will win based on the score, inning, outs, runners on base, and the run environment. These percentages are calculated using historical data, meaning if a team is losing and has a 24% win expectancy, only 24% of teams in similar situations in the past have ever come back to win.”  The numbers on the bottom represent the innings, and the center horizontal line represents a 50% chance of winning for each team.

Looking at the Win Expectancy Table, the Orioles chances of winning were 72.3% after the Fuld fly out.  Matt Joyce was then sent up to pinch hit for Lobaton, and as a result, the Orioles implemented a relatively common defensive shift, similar to the one shown below.

DA

Certainly, Joyce’s tendencies to hit the ball to the right side of the field (about 50%), as well as hit the ball on the ground to the right side (48.2% GB rate on balls hit to the right side of the field) called for that shift.  However, it leaves the entire left side open and Joyce bunted the ball down the third base line for an easy single.  That bunt single event decreased Baltimore’s chances of winning by 5.4%.  That doesn’t sound like a lot, but let’s take a look at the run expectancy matrix using the data from 2012 (the run expectancy matrix provides the number of runs that an average MLB team will score in an inning given any combination of baserunners and outs).

By employing the shift on Joyce, Baltimore was essentially trying to prevent a double at the expense of a guaranteed “single” (which Joyce took advantage of).  We’ll rule out a triple, since they’re not as common and Joyce isn’t a particularly fast runner, and home runs because the defense can’t prevent them.  With Joyce on 1st base and one out, the Rays were expected to score 0.51 runs that inning.  If Joyce would have hit a double instead, the run expectancy with a runner on 2nd base and one out only increases to 0.655.

Kelly Johnson followed, and again Baltimore shifted their defense to the right side, but this time, with JJ Hardy much closer to third base, as shown here.

Defensive Alignment

Where the shift was warranted against Joyce, the use of it against Johnson was suspect, as he has hit roughly 41.6% of his balls in play to the right side.  Johnson also showed a bunt on the first pitch, trying to catch the Orioles off guard a second time in a row.  Johnson ended up hitting a ground ball (where the shortstop is normally positioned) that went for a single instead of an inning-ending double play, resulting in Matt Joyce advancing to third.

Employing the shift and getting burned by it twice in subsequent at-bats lowered the chances of the Orioles winning from 72.3% to roughly 50%, even though they held a one-run lead at the time.  Additionally, now the Rays had a runner on first and third, with one out (a run expectancy of 1.15), giving them a very good chance to tie the ball game or even take the lead.  Tampa Bay ended up scoring 3 runs against Strop, taking a 7-5 lead.    And while the Orioles eventually tied it up, this inning played a big part in Tampa Bay’s victory.

So did the Orioles just run into some bad luck in the bottom of the 7th, or did they put themselves in a disadvantaged position that the Rays could exploit?  The short answer is probably a little bit of both.  Buck Showalter is considered one of the better managers in baseball, and I’m not going to sit here and pretend to know as much as he does or have as much information on the batted ball tendencies of the opposing team’s hitters.  Additionally, there are legitimate reasons to employ a shift on certain hitters, especially if they exhibit extreme batted ball tendencies (if teams didn’t think a shift is effective, they wouldn’t do it).

However, in this particular situation (7th inning, one-run lead), I do not think the shift was warranted given the detrimental value of putting runners on base.  Additionally, over-shifting could limit the pitcher’s ability to use both sides of the plate and his potential effectiveness (for example, left handed hitters will have an easier time hitting an outside pitch to the left side of the field, where bigger holes exist).  In fact, Kelly Johnson’s ground ball single was on a fastball on the outer corner of the plate.  You could possibly talk me into using the shift against Joyce here, but employing the shift against Johnson was unnecessary and ultimately changed the course of the game.

I’m not the first to have this idea, but I’m curious how many times it would take a particular batter to bunt against the over-shift for the defense to abandon it.  I don’t think anyone will ever try it, but having one person in your lineup guaranteed to reach base at every plate appearance would lead to more runs, especially over the course of the entire season.  At some point, you would think the defense would have to make an adjustment, and it would be interesting to see when that point is reached.  Perhaps this is a good topic for future post…

Orioles on Pace for a 162-0 Season

Posted in Uncategorized with tags , , , on April 3, 2013 by oriolesprovingground

The Orioles won their first game of the season last night, putting them on pace to finish the season undefeated.  They thoroughly embarrassed Tampa Bay 7-4, and it could have been much worse if they hadn’t shown the Rays mercy by choosing to leave an additional 8 runners on base.  Basically the only thing left to do is for the American League to win the All-Star game so the Orioles will have home field advantage in the World Series…not that they would need it.

2013 Projections for the Baltimore Orioles

Posted in Offseason, Projections with tags , on March 31, 2013 by oriolesprovingground

With opening day of the 2013 regular season just around the corner, I thought it would be fun to look at a couple of projections for the AL East and some Orioles players to see how fancy schmancy computer programs thought this year would turn out.  And if you’re a fan of the Orioles, you probably won’t like what you see.

Zips Projection System

First up is the Zips projection system, which was created by Dan Szymborski (used at Fangraphs).  On Tuesday, Szymborski posted an article on ESPN projecting the standings for each division (Insider subscription required).  How does Zips work?  According to Szymborski:

“Seasons are simulated a million times using a Monte Carlo method, the percentile performance of player projections and estimates of roster construction.”

The Fangraphs Library also has a definition if that wasn’t enough.  In addition to projected wins and losses, the table includes (in order) the percentage each team has to win the division, finish in last place, earn a wildcard, make the playoffs, and win the world series.

Team

W

L

GB

PCT

DIV%

LAST%

WC%

PLAYOFF%

WS WIN%

Toronto

94

68

0.580

42.90%

5.80%

25.20%

68.10%

6.90%

Tampa Bay

88

74

6

0.543

23.10%

13.40%

25.80%

48.90%

4.50%

Boston

84

78

10

0.519

13.20%

23.30%

20.90%

34.10%

3.00%

New York

83

79

11

0.512

11.30%

26.70%

18.40%

29.70%

2.60%

Baltimore

82

80

12

0.506

9.50%

30.70%

16.70%

26.20%

2.20%

If you’re wondering how the projected lineup and starting rotation are expected to perform, you’re in luck…


Projected Opening Day Lineup

Name

POS

AVG

OBP

SLG

WAR

Brian Roberts

2B

0.244

0.309

0.363

0.2

Nick Markakis

RF

0.281

0.350

0.428

2.0

Adam Jones

CF

0.277

0.326

0.474

3.6

Matt Wieters

C

0.256

0.330

0.433

4.5

Chris Davis

1B

0.252

0.308

0.450

0.9

J.J. Hardy

SS

0.258

0.304

0.424

3.5

Nate McLouth

LF

0.231

0.318

0.379

1.2

Nolan Reimold

DH

0.246

0.322

0.420

1.0

Manny Machado

3B

0.252

0.311

0.418

2.7


Projected Starting Rotation

Name

W

L

ERA

WHIP

K/9

BB/9

FIP

WAR

Jason Hammel

9

6

3.72

1.27

7.98

2.98

3.59

2.5

Wei-Yin Chen

10

8

4.10

1.23

4.86

1.85

4.44

1.3

Miguel Gonzalez

6

7

4.57

1.43

6.60

3.61

4.59

0.3

Chris Tillman

14

12

4.29

1.31

6.90

3.04

4.44

1.3

Jake Arrieta

8

11

5.16

1.51

7.09

4.23

4.81

0.5


PECOTA

If you didn’t find the projection provided by the Zips system to your liking, you should probably stop reading, because the PECOTA projection system developed by Nate Silver and Baseball Prospectus looks worse.  To make its projections, PECOTA relies heavily on statistics in a player’s previous seasons and statistics of historically similar players.

Team

W

L

GB

PCT

DIV%

WC%

PLAYOFF%

WS WIN%

New York

88

74

0.541

45.8%

21.2%

67.0%

9.0%

Tampa Bay

85

77

2

0.525

25.4%

23.5%

48.9%

4.7%

Boston

83

79

5

0.511

15.0%

19.0%

34.1%

2.6%

Toronto

82

80

6

0.506

12.0%

16.2%

28.2%

2.0%

Baltimore

75

87

13

0.462

1.7%

3.4%

5.0%

0.2%

As you can imagine, the individual player projections in PECOTA aren’t as high on the Orioles players as Zips, and I don’t want to add to the negativity of this column, so we’ll leave those out.

So what is the take away of this?  Well there’s good news and bad news.  The bad news is the projections don’t think the Orioles have much of a chance to return to the playoffs.  The good news is that last year, the Orioles made the playoffs when the projection systems didn’t give them much of a chance.  There is a reason why the games are actually played, and it’s because no matter how sophisticated a computer model you have, it can’t predict the future, and it sure can’t predict baseball.

On that note, happy Opening Night and enjoy the season!

2012-2013 Offseason Recap

Posted in Offseason with tags , , on March 30, 2013 by oriolesprovingground

On Monday we looked at a recap of the Orioles 2012 season, and tried to make sense of their unlikely run to the playoffs.  Today, we will take a look at what they could have done to improve, what they should have done, and what they did do.

Last year, the Orioles had a payroll of just over $84 million. The team led the league with 15 arbitration eligible players, each requiring a raise.  The team agreed to contracts with 11 of those 15, for amounts totaling almost $31 million, adding an additional $18 million to the 2012 payroll.  With that in mind, we’ll assume that expensive free agents may add too much money to the team’s already increasing payroll. Just trying to avoid using monopoly money in this exercise.  Additionally, Baltimore’s minor league system is very strong at the top (with RHP Dylan Byndy, RHP Kevin Gausman, and INF Jonathan Schoop), but lacks depth, so an impact trade would be difficult to produce without including one of those 3 players.  With that in mind, these 3 players will not be included in any potential trades.

Monday’s post concluded that based on current roster construction, the best areas to upgrade were at 2B, LF, SP.

Second Base

What they COULD Have Done: Not much.  First off, the team already has $10 million committed to Brian Roberts, who is in the last year of his $40 million contract he began in 2010.  Roberts hasn’t done much since signing that contract, playing in 115 games over the previous 3 years due to a multitude of injuries. However, prior to 2010, Roberts was an elite second baseman, averaging roughly 4.5 WAR from 2005-2009.  If he can stay healthy (a HUGE if), he should be able to produce 2.0 WAR in 2013 (roughly average, which is good).  A healthy Roberts and his career .351 OBP will improve the team’s OBP and baserunning at the top of the order.

Additionally, there wasn’t much on the free agent market, with Jeff Keppinger and Marco Scutaro the best second basemen available.  Both signed for multi-year deals and don’t really represent a significant upgrade over a healthy Roberts.  The trade market also appeared to be slim, with potentially a couple of buy low candidates in Gordon Beckham and Johnny Giavotella.  Again, neither represents an upgrade.

What they SHOULD Have Done: Pray that Brian Roberts stays healthy in his contract year, and maybe get some Brian Roberts insurance (you know, because he’s hurt a lot).

What they DID Do: They claimed Alexi Casilla off of waivers to act as a back-up infielder/Brian Roberts insurance.  With a career triple slash line of .250/.305/.334 (AVG/OBP/SLG) Casilla doesn’t offer much with the bat, but can provide value with solid defense and baserunning.

Left Field

What they COULD Have Done: Nolan Reimold looked good in LF to start 2012, but got hurt after 16 games and never returned.  Nate McLouth did an admirable job filling in following Reimold’s injury, but his recent history prior to his surprising 2012 makes his productive half season with the Orioles look a little fluky.  In fact prior to being signed by Baltimore, McLouth was released by the Pirates (the PIRATES!!!!!) after hitting .140/.210/.175.  He fared much better in Baltimore, but no one would blame you if the thought of Nate McLouth as your starting LF made you a little nauseous.

A lot of options on the free agent market, several of them being potentially good fits for the Orioles.  Some OF free agents such as Torii Hunter, Angel Pagan, and Melky Cabrera did not require the Orioles to give up there 2013 1st round draft pick (#22 overall), while others, including Nick Swisher, Josh Hamilton, BJ Upton, and Michael Bourn would leave Baltimore without the pick.  As mentioned previously, Baltimore’s minor league system is very thin after the top 3, so that pick has a lot of value to the team at this time.  Potential trade options included Denard Span, Chris Young, and Josh Willingham.

What they SHOULD Have Done:   Hindsight is 20/20, but the best option the Orioles had was going after Torii Hunter for the amount the Tigers signed him (2 years, $26 million).  Hunter is unlikely to repeat his 2012 (.389 BABIP compared to a career BABIP of .307), but signing him to play LF would bring in a player with solid, if unspectacular on-base skills (career .335), a well above average defender in a corner OF position, and an average baserunner at this point in his career, on a short contract without having to give up a draft pick.  Of the available free agents requiring Baltimore’s draft pick, Swisher is the only one I would have attempted to sign given his consistent mix of on base ability and power (career .256/.361/.467 line), solid defense, and positional flexibility, as he can play in either corner OF spot and first base.

As far as trades, the Oakland A’s basically stole Chris Young from the Diamondbacks, so he would have been the best target in my opinion.  His batting average keeps his OBP low (career .239/.318/.437 hitter), but he can draw a walk or to, with a career walk rate of 10%.  He is also an excellent defender and a good baserunner.

What they DID Do:  The Orioles resigned Nate McLouth and are hoping for Nolan Reimold to remain healthy, as those two look to be getting the most playing time in LF.

Starting Pitcher

What the COULD Have Done:  The Orioles starting pitching unit in 2012 consisted of surprises (Jason Hammel, Wei-Yin Chen, Miguel Gonzalez, Steve Johnson, Chris Tillman) and continued disappointment from recent top prospects (Jake Arrieta, Brian Matusz, Zach Britton).  Going into 2013, the rotation features a lot of upside, albeit with a lot of uncertainty.

Several free agents who would not cost a draft pick were available, including Zack Greinke, Anibal Sanchez, Brandon McCarthy, and Edwin Jackson.  Greinke (career 3.45 FIP and 8.09 K/9) is the only one of that group that would be a significant upgrade, but his asking price was too high for Baltimore’s budget.  As far as impact starting pitcher’s, the trade market wasn’t much better, with Rick Porcello and Trevor Bauer likely being the two starting pitchers the Orioles could have potentially acquired without giving up their top 3 prospects.  And while each of them have upside, neither of those two are necessarily upgrades in 2013.

What they SHOULD Have Done:  Basically stay away from the free agent market.  Brandon McCarthy would have been a solid pick-up as a free agent (signed with Arizona for 2 years, $15 million), although he would come at a significant risk, since he’s averaged less than 95 innings per year mainly due to injury. Realizing that his career stats do not quite match up with the Orioles starting pitching needs, I think a trade for Rick Porcello would have benefitted the Orioles (career 4.26 FIP and 5.00 K/9).  Despite already accruing over 3 years of service time, Porcello is only 24, and still has plenty of upside.  He’s a groundball pitcher (career 52.3% GB) who’s had terrible infield defense behind him throughout his career, so you could expect his ERA to improve with an infield defense better than Detroit’s.  Just speculating, but I believe an offseason trade of JJ Hardy and Jim Johnson for Rick Porcello and Jhonny Peralta would have been fair.  Closers like Johnson can be overrated and while it hurts to trade Hardy, it allows you to move Manny Machado over to SS, while Peralta gives you a short-term solution at 3B.

What they DID Do:  Other than sign Jair Jurrjens, they basically brought everyone back from 2012, and I can’t really fault that strategy.  Despite disappointing careers to date, Jake Arrieta, Brian Matusz, Chris Tillman, and Zach Britton still have upside.  Tillman showed promises of breaking out last year with increased fastball velocity and a 2.93 ERA over 86 innings.  Arrieta, a 2012 victim of bad luck (.320 BABIP and 57.3 LOB%) resulting in an ERA over 6, still posted 1.6 WAR with a strong strikeout rate over 22%.  Additionally, another strong year from Hammel and Chen seem likely.  Add in the fact that Dylan Bundy and Kevin Gausman are waiting in the minors, and there is a good chance the rotation improves just by staying the course.

Overall, the Orioles offseason strategy was sound, despite the fact that for the first time in years, the AL East appears wide open.  Baltimore likely realized that they did not have the farm system to make over the big league team like the Blue Jays, and resisted the free agent market, allowing them to keep their draft pick and retain financial flexibility in the future.  The 2012 run to the playoffs was a nice surprise, but the Orioles probably need a little more time to turn into a perennial contender…but I hope I’m wrong.

Quick Recap of 2012

Posted in Offseason with tags , on March 26, 2013 by oriolesprovingground

The Orioles had a surprisingly successful 2012, not only finishing above .500 for the first time since 1997, but also making the playoffs, defeating the Texas Rangers in the wild card game, and taking the Yankees to the brink of elimination before losing Game 5 of the Division Series.

How did the Orioles succeed in 2012?  They maneuvered their 40-man roster incredibly well and had a ton of luck.  Luck is something that I will refer to a lot on this website, as it can play an important part in baseball.  Luck (good or bad) will eventually even out with more games played, but over a small sample of games, it can play a big difference.  This is a reason why, over a 162 game season, you generally see the best teams qualify the post-season, while the playoffs are much more unpredictable.  Extended streaks of good or bad luck are rare, but they can happen.  Before we look at how lucky the Orioles may have been in 2012, let’s take a look at some of their team statistics from 2012, and compare them to the rest of the American League and MLB.

2012 Batting

Statistic

Value

Rank in AL

Rank in MLB

Runs Scored

712

9

15

Batting Average

.247

10

20

OBP

.311

11

23

SLG

.417

6

11

wOBA

.317

6

11

UBR

-4.4

11

25

Offensive WAR (as per Fangraphs)

0.54

7

12

The Orioles were average or below average in all of the above offensive categories.  While they hit 214 home runs (2nd behind the Yankees), they struggled to get on base and were terrible at baserunning.  Increasing the team’s OBP would help the offense greatly, specifically by turning those home runs into more of the 2 and 3 run variety.   From an on-base standpoint, the main culprits contributing to these below average numbers were located at 2B, 3B, SS, and LF positions, which posted OBP’s of .273, .302, .282, and .300, respectively (all of which ranked 25th or worse in MLB).  Significantly upgrading 4 positions can be difficult.  However, a bounce back year at the plate for J.J. Hardy, (never a high OBP guy, but much better power and glove tools than the average SS) and a full year of Manny Machado at the hot corner essentially reduces the number of upgrades to essentially two positions.

OFFSEASON UPGRADE:  2B and LF

2012 Pitching

Statistic

Value

Rank in AL

Rank in MLB

Runs Against

705

8

17

Starters IP

937.2

9

20

ERA

3.90

6

13

FIP

4.20

8

21

K/9

7.14

10

25

BB/9

2.92

8

13

WAR (as per Fangraphs)

16.6

7

15

Notice anything similar to the rank of pitching statistics to the offensive ones?  They’re basically all average to below average as well.  The bullpen itself produced 6.4 WAR (ranking 5th in all of baseball), while pitching in less than 37% of all innings.  This effective relieving unit is basically returning for 2013 intact, so the main area for improvement would be among starting rotation.  In 2012, the Orioles lacked a true #1 starter, despite very strong performances from Jason Hammel (2.9 WAR in 118 IP) and Wei-Yin Chen (2.2 WAR in 192.2 IP).  Looking at the table, the two statistics they needed to improve most were strikeouts and innings pitched by starting pitchers.  Doing this would decrease the fielding opportunities for the below average defense (see below) and prevent the very effective bullpen from wearing down over the course of the long season.

OFFSEASON UPGRADE:  Starting Pitcher(s)

Fielding

Statistic

Value

Rank in AL

Rank in MLB

Fielding %

0.983

10

17

UZR/150

-4.3

12

26

Defense was another issue for the Orioles in 2012 as both traditional defensive statistics and advanced statistics saw them as a well below average defensive team.  In addition to ranking 10th in the AL in fielding percentage, every position except for C and SS posted a UZR/150 below average.  The healthy return of Nick Markakis in RF (league average defender over his career, according to UZR) and a full season of Manny Machado at 3B (13.2 UZR/150 in 2012…although in an EXTREMELY small sample) will improve the defense at positions that were mainly occupied in 2012 by below average defenders in RF and Mark Reynolds (who may be legally blind) at 3B.  In a conveniently symmetric way, the biggest areas of improvement can be found at 2B (-6.6 UZR/150 in 2012) and LF (-3.9 UZR/150) in 2012.*

OFFSEASON UPGRADE:  2B and LF

*Orioles centerfielders (mainly Adam Jones) actually had a slightly worse UZR/150 than LF, but Mr. Jones not only won the AL Gold Glove for CF, but is also signed for the next 6 years, so he’s not going anywhere.

If the Orioles were this bad at every aspect of the game, compared to the rest of the league, how did they end up finishing 93-69 and making the playoffs?  As mentioned above, it was effective roster manipulation and luck.  The way the team manipulated its active roster in 2012 was nothing short of brilliant, with the names on the major league team changing (and contributing) almost daily.  Though instead of analyzing this further, I will just give the front office a hypothetical pat on the back on move on (may be a good topic for a future post).

As for luck, there are 3 factors that their impressive 2012 may have been a mirage.

1)     Orioles Pythagorean Expectation

This theory demonstrates that a team’s record should loosely correspond with the number of runs they score compared to the number of runs they allow, which if you think about it, makes sense.  The good teams will score more than they give up, while the bad teams will do the opposite.  Based on the fact that the Orioles scored 712 runs and gave up 705 runs, they were expected to have a record of 82-80.  This indicates the Orioles true talent was closer to a .500 team rather than the 93-69 team that made the playoffs.

2)     Orioles Record in 1-Run Games

The Orioles went an insane 29-9 (.763 winning percentage) in one-run games, which was the best winning percentage in one-run games since the 1890 Brooklyn Bridegrooms.  Don’t be embarrassed, I don’t know who they are either.  While some of the team’s success in one-run games is due to their stellar bullpen, luck, which is believed to play a large role in the outcome of one-run games, is likely the reason for their near-historic winning percentage.  Think about it, if they had gone 19-19 in one-run games, they would have finished with an 83-79 record, much closer to their Pythagorean Expectation.

3)     Orioles Record in Extra-Inning Games

The Orioles went an equally insane 16-2 in games decided by extra innings, including 16 wins in a row.  Similar to one-run games, winning extra-inning games is generally perceived as a function of luck, and the Orioles definitely seemed to have an abundance of it in 2012.

Obviously, there is more to the Orioles 2012 season than the contents of this post, however, 2012 is in the rear-view mirror and we must move on.  Next, we’ll use this information to help look at what the Orioles did this offseason (or more accurately, what they didn’t do) and why that may have been a good thing.