Archive for Chris Davis

The Camden Highball (Episode 8): Get to Know Your Orioles Prospects

Posted in Offense, Podcast, Prospects with tags , , , , , , , , , on April 20, 2015 by oriolesprovingground

It’s Monday, so that means there is a new podcast over at ESPN Sweetspot Network Orioles blog Camden Depot.  This week’s guest on the Camden Highball is Tucker Blair of the Baseball Prospectus prospect team to discuss Orioles prospects and Baltimore’s minor league system.

Direct Link to Article –> The Camden Highball: Get to Know Your Orioles Prospects

How the Chris Davis Suspension Affects the Rest of the Season

Posted in Offense, Playoffs with tags , on September 13, 2014 by oriolesprovingground

Yesterday, Chris Davis was suspended for 25 games by major league baseball for using performance enhancing drugs.  He’ll miss the team’s remaining 17 regular season games and at least 8 playoff games, as long as the Orioles are fortunate enough to play that many.  Today at ESPN Sweetspot Network Orioles blog Camden Depot, I take a look at how that may affect the team moving forward.  Surprisingly, it may not change much at all.

Direct Link to Article –> How the Chris Davis Suspension Affects the Rest of the Season

Can History Tell Us Anything About Chris Davis’ Return from the Disabled List?

Posted in Offense with tags , , on May 15, 2014 by oriolesprovingground

Chris Davis came off the 15-day disabled list this past sunday after missing time due to a strained oblique.  Today over at ESPN Sweetspot Network Orioles blog Camden Depot, I take a look at similar players who have suffered the same injury and compare how they performed before their injury to how they performed after being injured in the hope that the findings will give some sort of indication as to what we can expect from Davis the rest of the season.

Direct Link to Article –> Can History Tell Us Anything About Chris Davis’ Return from the Disabled List?

Projecting the 2014 Orioles: Offense

Posted in Offense, Offseason, Projections with tags , , , , , , , , , , , , , , on March 26, 2014 by oriolesprovingground

Following a surprise playoff appearance in 2012, the Baltimore Orioles finished the 2013 season with an 85-77 record, 12 games out of first place in the American League East and 7 games out of the wild card spot.  Despite not making the playoffs, the 2013 team was arguably more talented than the 2012 team, due to reasons that we’ve discussed before. This offseason was relatively quiet until around the start of spring training when the team made several moves to improve roster holes leftover from 2013 (starting rotation and designated hitter). Despite what looks to be an upgraded team, the Zips Projection System at Fangraphs currently sees them finishing the 2014 season at the bottom of the AL East with a record of 78-84. Let’s take a closer look at how Zips came to that conclusion.*  This is more informative than actual analysis, but I think it is still be a worthwhile exercise.

*Note: this post as written before Zips made its final projections for the season, so things will probably change slightly in the next week.

Catcher

2014 Zips Projection

2014 Zips Projection

In 2013, Baltimore catchers produced a total of 1.9 fWAR, which placed them 18th in all of baseball. The bulk of that production came from Matt Wieters (2.4 fWAR), but the backups added -0.5 wins in only 101 plate appearances.  Offensively, Zips sees Wieters improving on his disappointing 2013 season, while once again playing a lot at the position.*  I personally believe that the projection for Wieters is slightly on the low side, and that he has a decent chance to exceed it.

Continue reading

What Can the Orioles Expect from Matt LaPorta?

Posted in Free Agency, Offense, Offseason with tags , , on February 19, 2014 by oriolesprovingground

The Baltimore Orioles have been busy little bees the last couple of days by signing RHP Suk-min Yoon out of Korea as well as one of the best remaining free agent starting pitchers in right hander Ubaldo Jimenez.  Everybody is talking about them, and for good reason, because they both constitute the biggest signings the team has made so far this year (sorry Ryan Webb, but you’ve been bumped).

I’m sure I’ll discuss those two at some point, but since everyone else is discussing them right now, I figured I’d talk about Matt LaPorta.  Remember him?  If you do, get reacquainted with a trip down memory lane, and if you don’t, then get to know him.  Either way, head over to the ESPN Sweetspot Network Orioles blog, Camden Depot and see if the Orioles can find lightning in a bottle.

Direct Link to Article –> What Can the Orioles Expect from Matt LaPorta?

Who is the Most Clutch Oriole?

Posted in Offense with tags , , , , , , , on August 23, 2013 by oriolesprovingground

The following post was written by Doug Nickerson as a guest post for Orioles Proving Ground.  Nickerson grew up as a Red Sox fan on Cape Cod, MA and is looking forward to writing about the Orioles with his knowledge of the AL East from a non-emotional perspective.  He moved to the DC area last August, and while he loves the city, he hates humidity and traffic.

In watching so many games this year with the purpose of evaluating the players instead of solely enjoying the beauty of the game, many ideas have percolated from the frustrations of watching teams struggle to score, while others seem to score with ease.  Now obviously some matchups are lopsided causing teams to either easily run up the score or look helpless at the dish.  But the real question I ask myself is, what is the relationship between being good and being able to perform under pressure?

On the surface, the Orioles haven’t been able to turn it on when it counts this year compared to last year, especially when considering their record in 1 run games has gone from 29-9 in 2012 to 14-22 this year.  What’s the cause of this? Is it purely luck? Did last year’s team have nerves of steel compared to this year or is it just the law of averages taking its course?

To compare this year and last year, I needed to look at clutch stats.  The easiest to compare is baseball-reference.com’s “clutch” stat, which is based on its win probability stat and average leverage index.  The clutch stat normalizes these numbers so that a player with a clutch rating of 0 is an average player and a positive or negative rating is more or less clutch, respectively.  Let’s take a look at the offensive numbers (I included guys with at least 45 ABs for the season).

2013 Clutch Rating

2012 Clutch Rating

Chris Davis

1.7

Adam Jones

1

Chris Dickerson

1.1

Taylor Teagarden

0.7

Adam Jones

1.1

Nate McLouth

0.6

Nick Markakis

0.7

Jim Thome

0.6

Steve Pearce

0.7

Mark Reynolds

0.4

Brian Roberts

0.6

Steven Tolleson

0.4

Alexi Casilla

0.5

Chris Davis

0.2

Manny Machado

0.4

Manny Machado

0.2

Danny Valencia

0.4

Matt Wieters

0.1

Yamaico Navarro

0.1

Steve Pearce

0.1

Travis Ishikawa

0

Nolan Reimold

0.1

Taylor Teagarden

0

J.J. Hardy

0

Henry Urrutia

0

Nick Markakis

0

Chris Snyder

-0.1

Endy Chavez

0

Nolan Reimold

-0.2

Brian Roberts

0

Nate McLouth

-0.3

Ryan Flaherty

-0.1

Matt Wieters

-0.4

Ronny Paulino

-0.1

J.J. Hardy

-0.5

Xavier Avery

-0.2

Ryan Flaherty

-0.8

Nick Johnson

-0.2

Omar Quintanilla

-0.3

Lew Ford

-0.4

Robert Andino

-0.7

Wilson Betemit

-0.9

Now, as expected, Chris Davis is the most clutch player on the 2013 team and that’s a reason why he is rightfully in the MVP race.  The surprising results of this stat is that 3 regulars are considered the most clutch hitters on the team (Davis, Jones, Markakis) and 3 regulars are considered to wilt during the big moments (McLouth, Wieters, Hardy) for the 2013 season.  When compared to last year’s team, only 2 players that got regular starts (Andino and Betemit with over 350 ABs each) had a negative rating.  This could be a potential reason for the drastic change in their record in 1 run games.  However, now the question arises as to how much are they affected by the big situation?  How much does 0.1 clutch point reflect into a player’s OBP in high leverage situations? Is it substantial, where all hope is lost if there are two outs, man on third, and the game is tied in the late innings? I find the clutch stat to be interesting but it leads me to more questions.

Now let’s take a look at each players OBP in different leverage situations to see if there is anything substantial.  I used OBP as a comparison, to measure the ability to keep the inning alive as critical to increasing your opportunity to score runs.  It is also a clean stat that is taken directly from the field and not manipulated in any way, unlike win probability, runs created, etc.

OBP Clutch Graph

From the chart, it can be seen that Nick Markakis is the most clutch batter on the team in getting on base in high pressure situations this year.  He also has nerves of steel as his OBP rises almost 100 points from his average when he is in a high leverage situation.  Matt Wieters appears to be deserving of his low clutch rating due to his drastically low OBP in high leverage situations.  However, the same can’t be said for J.J. Hardy or Nate McLouth.  Both are roughly the same or above their 2013 OBP average in high leverage situations, making them fairly clutch relative to themselves in low-pressure situations.  Five of six regular Orioles perform better when the pressure is on them to succeed.  This causes me to believe that the clutch rating stat has to be taken with a grain of salt when looking for it to translate onto the field.

With this in mind, I’ll look into the team’s clutch pitching numbers with my next post to see how the 2013 team is comparing to last year’s.

Camden Depot: Checking in With Chris Davis

Posted in Offense with tags , on June 25, 2013 by oriolesprovingground

I have a post up today over at Camden Depot that takes a look at the relative struggles of Chris Davis in the month of June.  His “struggles” are relative since he’s still playing pretty well.

Direct link to article –> Checking in With Chris Davis

Chris Davis: Too Good to be True?

Posted in Offense with tags , , , on May 4, 2013 by oriolesprovingground

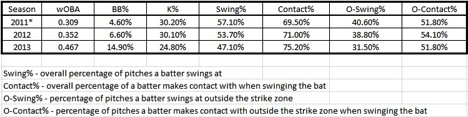
On Tuesday, Matt Kremnitzer over at Camden Depot took a look at the hot start to the season for Chris Davis, and came to the conclusion that his early season success can be attributed to his improved plate discipline.  Kremnitzer has a similar table in his piece, but take another look to see just how much Davis’ approach at the plate has improved so far this year, compared to his previous time with the Orioles (updated numbers for 2013).

Untitled

*2011 stats reflect Davis’ time with the Orioles only

Currently, Davis is sporting a triple slash line of .337/.438/.704, with a .467 wOBA (as of May 3rd).  Is he going to keep that up during the entire season?  Absolutely not!  But, as Kremnitzer pointed out in his piece, his improved approach at the plate is a very positive indicator that Davis has a good chance to continue his success over a sustained period of time.

However, before we start talking about Davis as a potential MVP candidate, there are some reasons to be skeptical of his hot start.  I bring this up not to be a “Debbie Downer”, but more to temper expectations.

The first (and easiest) indicator is with Davis’ BABIP, which is a lofty .387, despite a line drive rate that is currently a career low and roughly 3.5% below his career rate.  To put this into perspective, typically batters who hit a lot of line drives and/or are fast can sustain a high BABIP.  For example, Ichiro Suzuki has a career .347 BABIP, and Dexter Fowler (who is speedy) led the league in BABIP last year with .390.  He also happened to lead the league in LD% at 27.2%.  Davis is nowhere near as fast as Fowler and currently has a LD% of 19.7%.  However, the career BABIP of Chris Davis sits at .338, so even a regression to his career level won’t send his overall numbers off a cliff.  This is the good news.  Now here comes the bad news.

Chris Davis swings at fastballs down and in…and crushes them.  Check out the figure showing his SLG on fastballs over his career by zone, courtesy of Brooks Baseball and Baseball Prospectus (from catcher’s point of view).

SLG

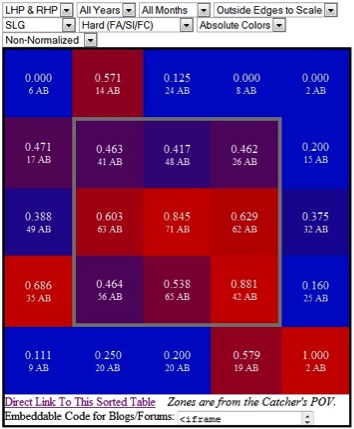
You may say that’s not bad news, or even that it’s not news at all, but it sets up the bad news.  And that is that Chris Davis also swings at pitches that initially look like meaty fastballs down and in, but turn out to be breaking balls (curveballs and sliders) that dart out of the strikezone.  As a result, he DOES NOT crush them, and often times he misses them completely.  This time, our trusty figure shows his swing rate on breaking balls, again from the catcher’s point of view.

SWG

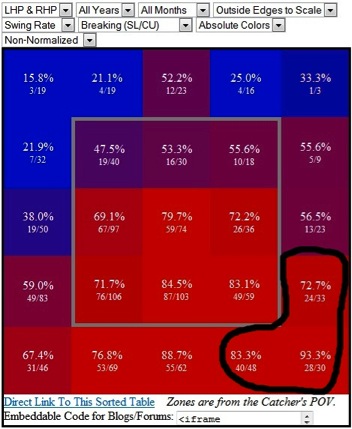
Pay special attention to the highlighted area out of the strikezone in the bottom right corner (pitches down and in to Davis) and make a mental note of how many times he swings at breaking balls there.  Now combine that swing percentage with the fact that he whiffs on breaking balls in that area more than 53% of the time (and 71.4% specifically in the zone on the bottom right).  Breaking balls thrown out of the strikezone down and in to Chris Davis is an undeniable weakness.

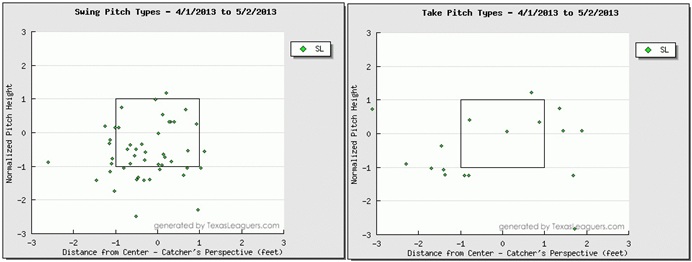
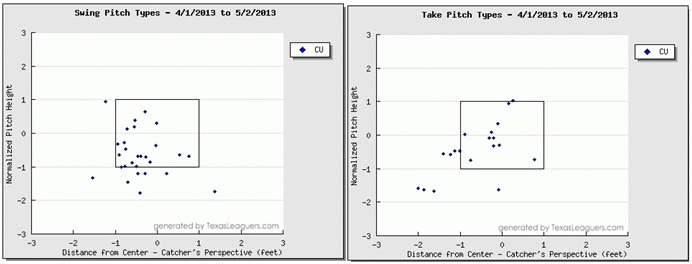
Let’s look at a few more figures, this time from 2013, courtesy of Texas Leaguers.  The first figure in each set shows pitch locations where Davis swung, while the second figure in each set shows pitch locations taken (again from the catcher’s point of view).  First, the sliders…

Sliders

Now, the curveballs…

Curveballs

For some reason, opposing pitchers haven’t thrown Davis many breaking balls down and in out of the strikezone this year.  I’m not sure why they wouldn’t throw breaking balls in that area with more frequency, other than the fear of making a mistake and getting punished (Davis will crush breaking balls that don’t find their way far enough inside).  Another potential reason could have something to do with the batters in front of Davis consistently getting on base, requiring pitchers to guard against the steal or a passed ball.  A pitch down and in to a left hander is a difficult spot for a catcher to receive, especially when trying to throw out a potential base stealer.

Chris Davis is off to an amazing start to the year and there are good reasons to believe that an improved approach at the plate is a bigger reason for it than plain old luck.  As the season progresses and pitchers throw more breaking balls out of the zone down and in to Davis, we’ll see if that improved approach includes laying off those pitches, giving us a better idea as to whether Davis is going to have another breakout year.