Pitching Under Pressure
The following post was written by Doug Nickerson, who is a frequent contributor at Orioles Proving Ground.
As a continuation of my previous post on the Orioles’ ability to handle pressure, I am now diving into the pitching staff. I wanted to determine which pitcher had consistently been able to succeed when the game was on the line. Some starters are able to rise to the occasion and match the opposing pitcher shutout inning for shutout inning in a game that is a must win. Sometimes that same pitcher is spotted a big lead, then slowly lets the other team right back into the game and then miraculously turns it around to pitch better when the game gets closer.
Unlike hitters, where OBP generally encompasses a batter’s ability to keep the inning rolling and scoring runs, I had a hard time finding one stat that would be the equivalent for a pitcher. Inherent in all pitching statistics is the variability element of the fielding behind the pitcher. With a poor fielding team behind him, the pitcher might react more stressed than if he knows he can trust his defense to make the plays. This led me to having difficulty in selecting which statistic to compare the pitchers in high, medium, and low leverage situations. Ultimately, I had to decide on reviewing multiple factors depending on the type of pitcher (starter vs. reliever). For starters I looked at ERA, while for relievers I also factored in the percent of inherited runners that scored, since part of the relievers role is to bailout the starter and finish the inning without allowing any runs.
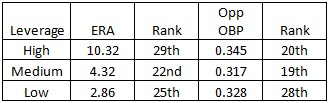
As a team, the Orioles pitching has been less than ideal. The starters rank 27th in the league with an overall ERA of 4.64, while the bullpen is only slightly better with a 3.74 ERA, placing them 20th in the league. Opponent’s OBP was relatively slightly better but still nothing to brag about. The chart below breaks this down even further into leverage situations for the entire pitching staff.
This makes this exercise even more important as to determine which pitchers they should keep when looking to improve in the offseason.
Using the “Clutch” stat provided by baseball-reference.com, the starting and relief staffs are as follows:
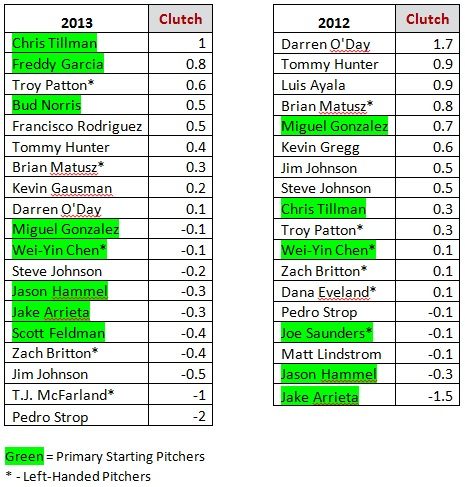
In general, the clutch stat gives an overview of the year to year fluctuation seen by pitching staffs, especially in bullpens. Any Orioles fan has known this year that the bullpen isn’t as strong as last year, even though the main characters are still the same. Jim Johnson hasn’t been the lights out closer he was last year. The same can be said for Darren O’Day, Brian Matusz, and Pedro Strop (probably why Strop was shipped out of town in the Feldman deal). The starters in clutch situations have been better but not great. The clutch stat is nice but needs to be taken as a general blurry picture of what’s going on. This is illustrated by how Freddy Garcia is the second highest ranked “clutch” pitcher on the staff!
Looking closer into the current starters leverage ERA vs. clutch rating can be seen below.
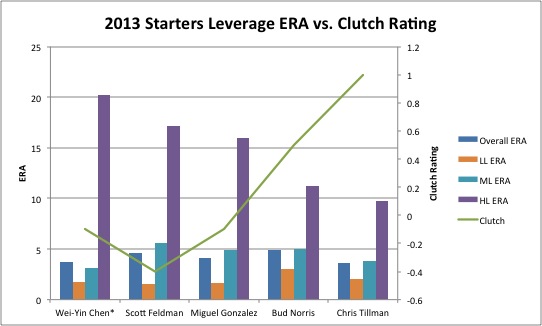
It’s very interesting to see that for starters, ERA is a direct correlation to the clutch rating. Scott Feldman has the lowest clutch rating, which can be seen in his high and medium leverage ERA. However, interestingly he counters that with the lowest low leverage ERA. Chris Tillman leads the team in overall ERA and it shows in his leverage splits. The most interesting pitcher on the staff I found to be Wei-Yin Chen. He pitches great in low and medium leverage situations but has been hammered this year in high leverage situations. With these results, it shows that Chen shouldn’t be trusted in those high leverage situations. It is better to take him out and put in Darren O’Day or Troy Patten, when considering their performance in the graph below:
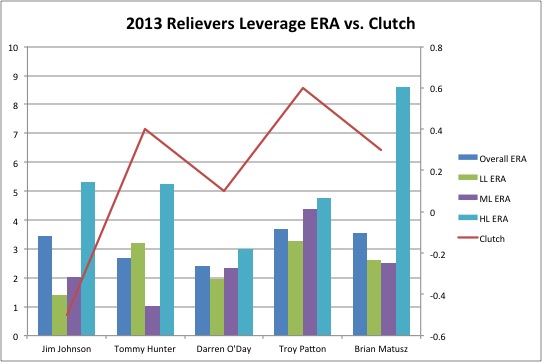
The bullpen this year has had its ups and downs. The most consistent pitcher no matter the situation has been O’Day followed by Patton. Matusz and Johnson have exceled in low and medium situations while getting smacked around in high pressure situations. Tommy Hunter has surprisingly done the best in medium leverage situations. Comparing the clutch rating to ERA isn’t as indicative for relievers, as seen by O’Day having the lowest set of ERAs but having the second worst clutch rating on the team. Curious to see if inherited runners scored is a similar non indicator of the clutch rating, I created the graph below.
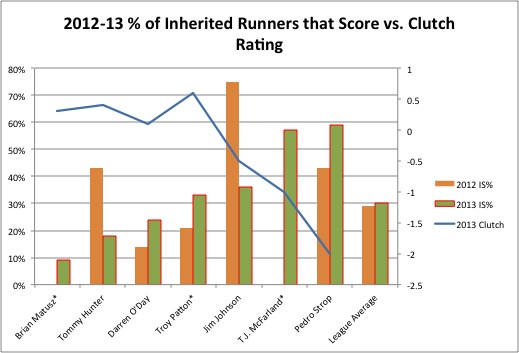
Inherited runners scored against appears to be a direct indicator of clutch level. As the percent of runners allowed to score went up the clutch rating went down. The percent of inherited runners scored combined with the leverage ERA gives a better indication of when to bring in a reliever. Brian Matusz rarely lets inherited runners score but has trouble when an inning has the most pressure. Therefore, its best to use him in middle inning situations where there pressure isn’t too high but you need to get a guy out as the starter is struggling. Johnson has improved on inherited runners this year but he is still best used to start the ninth inning to capitalize on his hidden strengths of performing better without men on base and lower leverage situations. If Johnson were not able to pitch for a save situation or the team desperately needed a guy to come in and shut down the other team’s momentum, the choice is Darren O’Day. His percent of inherited runners scored has increased this year but it is still below the league average and he can perform under all pressure situations. The club looks to have a steal on their hands as O’Day is under contract for one more year with an option for 2015 at $4.25 million. The Orioles will likely enjoy his continued presence exceling in high pressure situations.

Leave a comment