Last week, the Cleveland Indians designated Mark Reynolds for assignment. Orioles fans should be familiar with Reynolds, as he spent all of 2011 and 2012 with Baltimore, coming over in a trade from the Arizona Diamondbacks. During his two years in Baltimore, he accumulated -0.2 fWAR. Most of that was a function of the fact that he plays terrible defense (at any position) and doesn’t run the bases effectively. Despite the negative WAR, he was an above average hitter during his time in Baltimore, with a cumulative line of .221/.328/.458 (AVG/OBP/SLG), and a 112 OPS+ (meaning he was 12% better than the average hitter, who has an OPS+ of 100).
If you’ve read this blog at all, you should know that the Orioles have had trouble getting production out of the DH spot in 2013, since we’ve talked about it a couple of times. If you haven’t been reading this blog, you can find those discussions here and here. Baltimore’s designated hitters have combined for a .230/.275/.385 triple slash line, and a .288 wOBA, good for 14th in the American League. With that in mind, it would seem like the recently available Reynolds could provide an upgrade for Baltimore’s DH spot.
Through 99 games with the Indians this year, Reynolds has a triple slash line of .215/.307/.373, and a wOBA of .303. While Reynolds’ production this year would have been an upgrade over what the Orioles have gotten out of DH, it wouldn’t be much of one. Additionally, we don’t care about the past, we care about the future. Would Mark Reynolds provide more offense for the Orioles in their final 44 games than anything they already have available?
Overall, Reynolds’ season isn’t too far off from his career numbers. His AVG, OBP, BB%, K%, and BABIP are all at or around his career averages. The biggest difference in 2013 has been his lack of power. His current ISO of .158 is easily the lowest of his career, in addition to it being under .200 for the first time.
Reynolds has experienced two different seasons in 2013. There is the month of April, and then there is everything else. Take a look.
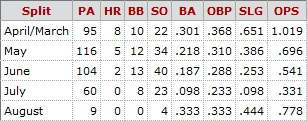
Provided by Baseball-Reference.com
Generated 8/13/2013.
That’s not trending downward, that’s falling off the cliff. The Indians stuck with Reynolds as long as they could, but they severely cut his playing time in July and eventually just took him off the roster completely.
Prior to their recent trip through the National League West, the Orioles have been using a mix of mostly Henry Urrutia, Danny Valencia, and Steve Pearce at the DH position. They have been deployed in a platoon, with the left-handed Urrutia getting most of the at-bats. There are small sample size issues with each player’s performance. Pearce leads all three in PA’s, with just 102 on the season. Despite that, let’s look at how they’ve done this year.
Henry Urrutia (47 PA’s) .298/.298/.340
Danny Valencia (78 PA’s) .216/.256/.500
Steve Pearce (102 PA’s) .261/.333/.402
Pearce owns the best triple slash line of the group and has Reynolds beat in every category. However, the majority of Pearce’s PA’s have come against left-handed pitching. He’s completely ineffective against right-handers and because of that, he can’t be counted on as an everyday DH. Urrutia, who has faced right handed pitchers almost exclusively since being called up, has an impressive average, but only has one extra base hit (a triple), and has not walked once. Valencia has hit for some power, but not much else. His average may be held down by his .216 BABIP (despite a line drive percentage around the league average), but his slugging percentage has been buoyed by his lofty 18.5% HR/FB rate, approximately 10% higher than his career level.
So where does that leave us? It leaves us with 4 terrible options at DH. While Dan Szymborski’s Zips projection system at Fangraphs sees Reynolds as a slightly above average hitter the remainder of the season, the depths of his terribleness in June and July make me think Zips is a little too optimistic. However, Baltimore fans know that Reynolds can occasionally go on one hell of a hot streak, which could make him very valuable to the Orioles down the stretch. If Reynolds is able to pass through waivers without getting claimed (VERY likely), the Orioles could roll the dice on him for basically nothing more than the cost of a roster spot. Given the limitations of Baltimore’s current options, it’s probably worth a shot.